Logs Page
Version 25.3.9396
Version 25.3.9396
Logs Page
CData Sync maintains logs for the following types of activities on the Logs activity page: application requests, access requests, and audit configuration changes. You access the Logs page by clicking the logbook icon in the top-right menu bar, as shown below:

Each log type is stored as a separate table in the application database, and each one has its own tab on the Logs page:
The following sections explain the details on the tabs for each of these log types:
-
Application
-
Access
-
Audit
Application Tab
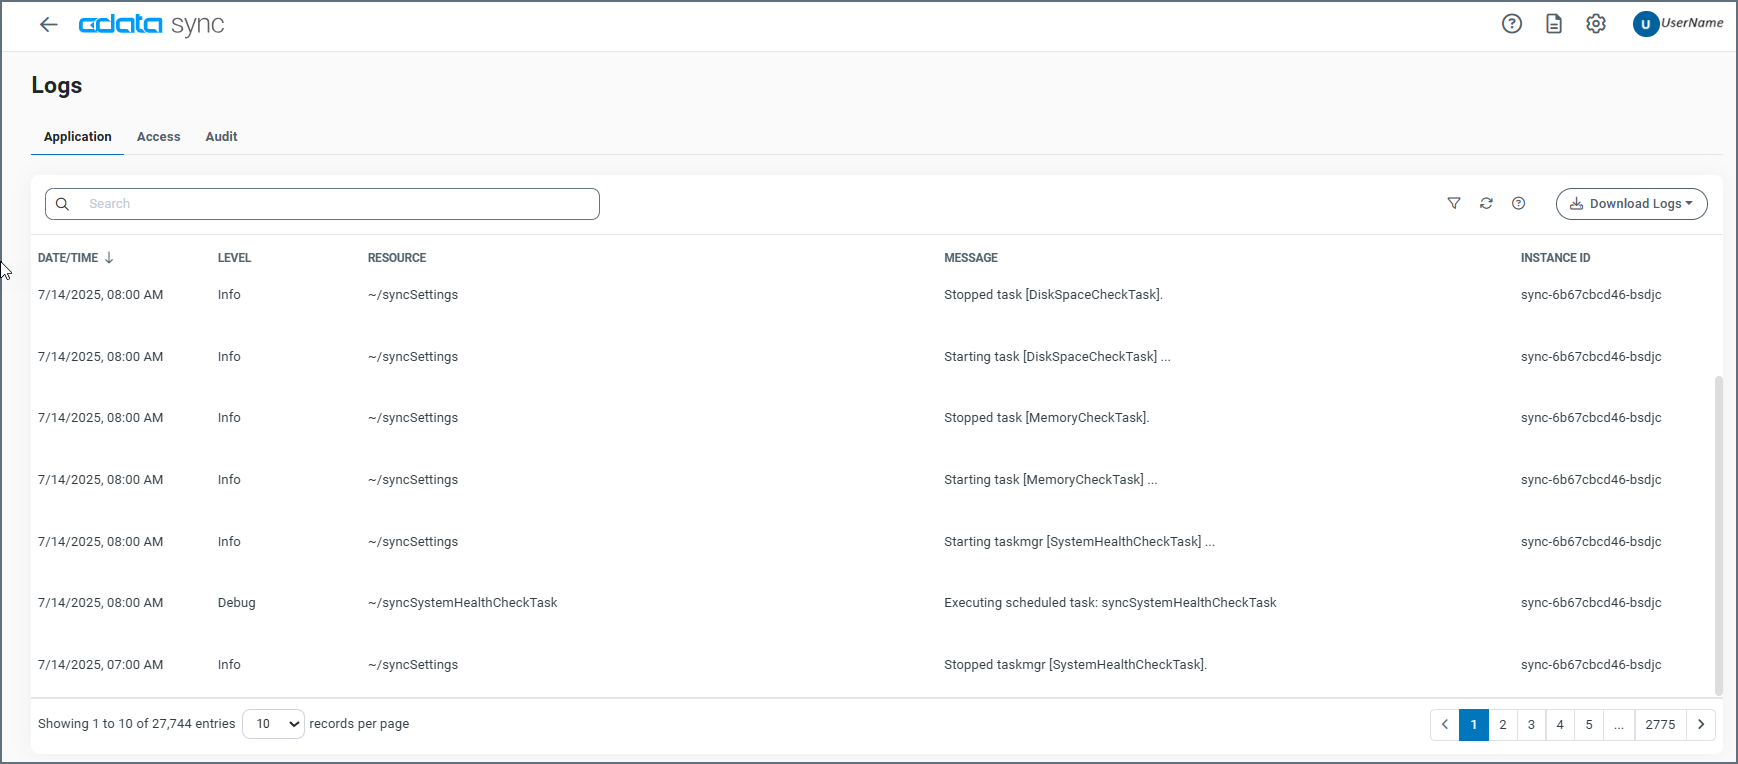
The Application tab records any application-level errors that occur during processing and any requests made to application resources. These error messages can help provide context to errors for specific transactions.
The Application tab includes a separate row for each application event, displaying the following details:
-
DATE/TIME - The timestamp for the event.
-
LEVEL - The log level. (Review the information in the Message column for details.) The application levels that are displayed in the column are as follows:
-
None - Events that are not logged.
-
Error - Information about errors that are encountered during processing.
-
Warning - Information about warnings that are encountered during processing.
-
Info - General information about the processing, including any errors and warnings (if applicable).
-
Debug - Detailed debugging information for both successful and failed processes.
-
Trace - Detailed trace information for both successful and failed processes. This information is useful if you need to send logs to CData Support.
You can change the log level in the Additional Settings section on the Advanced tab of the Settings page. However, increasing the verbosity of the logs can affect database performance, especially for less efficient database types like SQLite or Apache Derby. Only adjust the log level if you have a specific reason to do so.
Note: The logging levels Debug and Trace might log sensitive information, including file information and SSL certificates. Although sensitive details such as passwords are masked, you should review these logs for sensitive information before sharing them outside of your organization.
-
-
RESOURCE - The resource that produces the message.
-
MESSAGE - A message text about the event.
-
INSTANCE ID - The instance identifier (Id) of an application event.
You can organize your logs table in ascending or descending order by clicking the up (↑) and down (↓) arrows next to the column by which you want to sort.
You can also filter the table by time and log level. To clear a filter, click Clear in the drop-down list for each filter type.
To download logs to your local machine by clicking the Download Logs button in the upper right corner. You can choose to download logs from the past 1, 2, or 5 days.
Access Tab
The Access tab records entries for requests made to the Sync REST API. This tab displays the following details:
-
DATE/TIME - the timestamp for the transaction.
-
USER - The authenticated user who makes the request. If the user who makes the request is anonymous, this entry is blank.
-
METHOD - The HTTP method that is used.
-
REMOTE IP - The IP address from where the request originated.
-
INSTANCE ID - The Id of the instance that served the request.
You can organize your logs table in ascending or descending order by clicking the up (↑) and down (↓) arrows next to the column by which you want to sort.
You can also filter the table by time, methods, users, URLs, and remote IPs. To clear a filter, click Clear in the drop-down list for each filter type.
To download logs to your local machine by clicking the Download Logs button in the upper right corner. You can choose to download logs from the past 1, 2, or 5 days.
Audit Tab
The Audit tab stores each change that is made to the application configuration. This includes all actions like creating connections, configuring jobs, updating application settings, and so on. This tab displays the following details:
-
DATE/TIME - The timestamp for the configuration change.
-
USER - The authenticated user who makes the change.
- METHOD - The HTTP method that is used for the change.
- GET
- POST
- PUT
- MERGE
- PATCH
-
MESSAGE - A message text that describes the change that is made.
- INSTANCE ID - The instance Id for the action.
You can organize your logs table in ascending or descending order by clicking the up (↑) and down (↓) arrows next to the column by which you want to sort.
You can also filter the table by time, methods, and users. To clear a filter, click Clear in the drop-down list for each filter type.
To download logs to your local machine by clicking the Download Logs button in the upper right corner. You can choose to download logs from the past 1, 2, or 5 days.