Dashboard Page
Version 23.4.8839
Dashboard Page
Version 23.4.8839
The Dashboard is your CData Arc landing page. By default, it displays metrics for the last 7 days, but you can use the Show data for dropdown to select your preferred time period. The options are:
- Today
- Past 24 hours
- Past 3 days
- Past 7 days
- Past 30 days
- Past 3 months
- Past 12 months
Note: The time periods shown vary based on your cleanup interval settings, so you might not see all of the time periods listed above.
The dashboard is divided into a number of sections, each of which is covered below. The dashboard is user-specific, so you can customize it to fit your needs by using the Edit button at the top right of the page, or the Edit links on certain cards.
Video Resources
Watch this short video to learn more about the Dashboard options.
Key Metrics
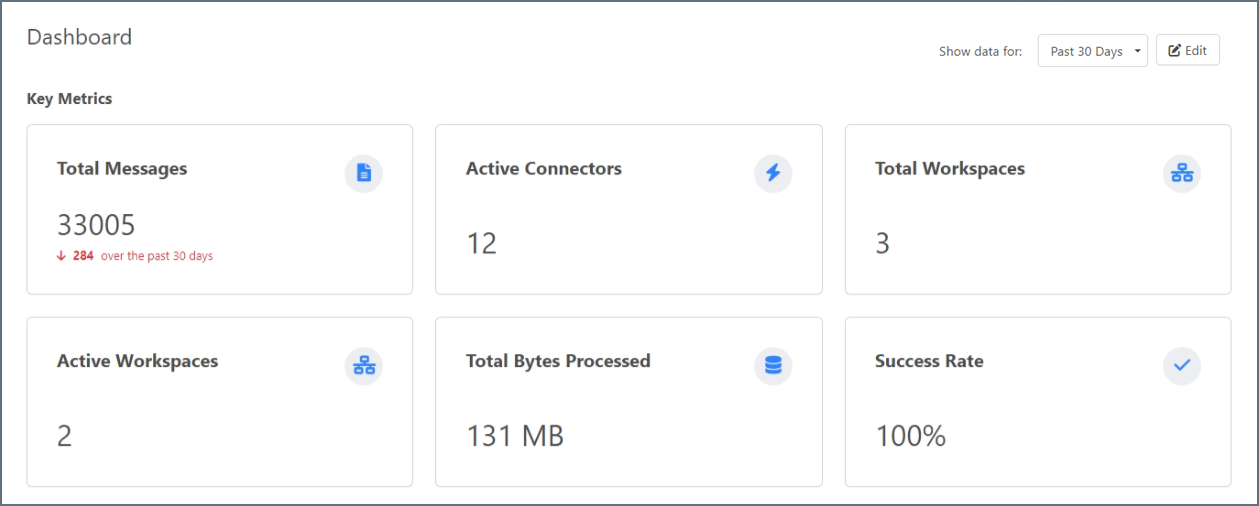
You can display between two and eight metrics that provide a view into your application’s health, volume, and usage. To pick your metrics, click the Edit button, then click the Edit link in the Key Metrics section. Choose from the following list:
- Total Messages
- Total Transactions
- Total Transactions Sent
- Total Transactions Received
- Total MFT Transactions
- Total EDI Messages
- Total Errors
- Total Send Errors
- Total Receive Errors
- Total Connectors
- Active Connectors
- Total Workspaces
- Active Workspaces
- Total Bytes Processed
- Average Bytes Processed
- Success Rate
- Failure Rate
- SLA Violations
- At Risk SLAs
Trends
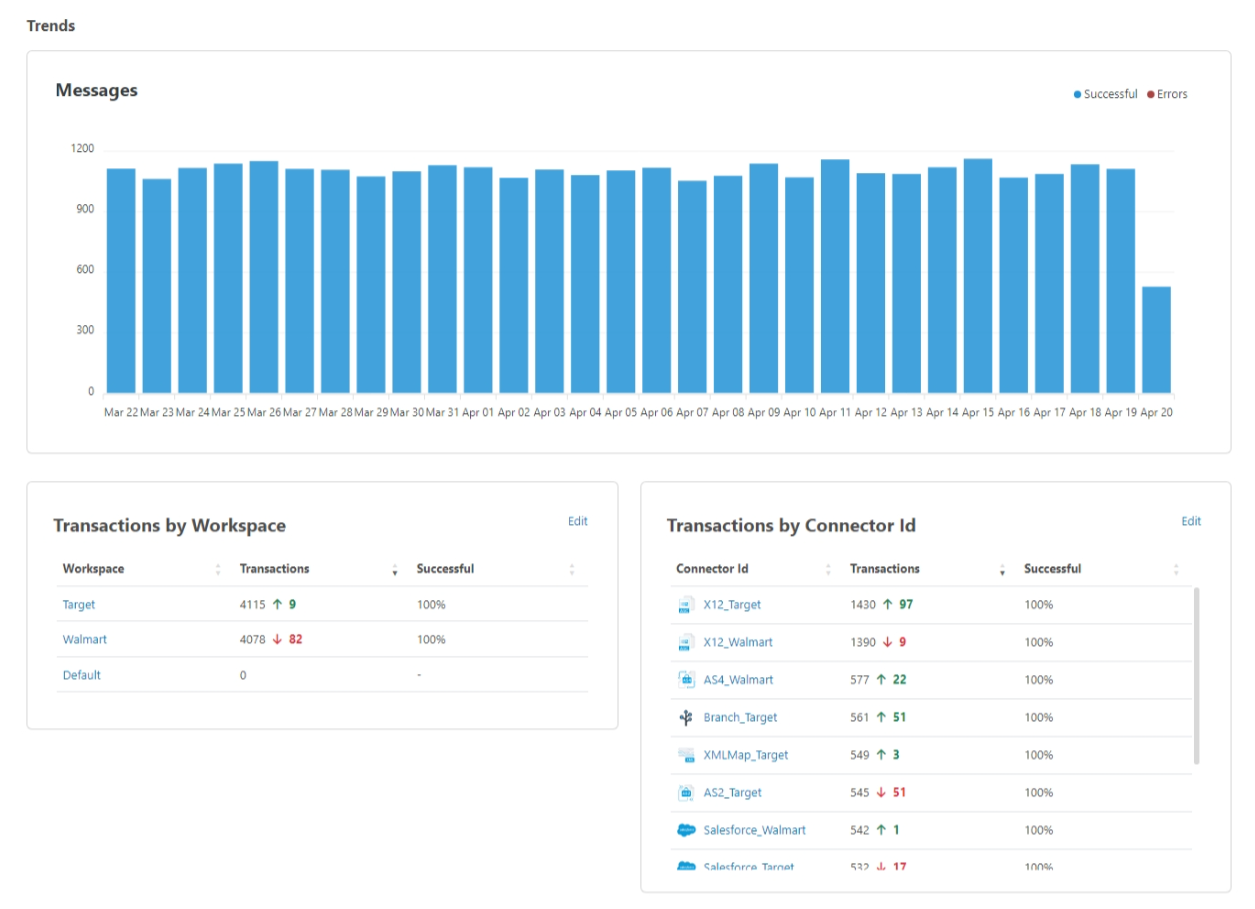
The Trends section helps to identify trends for message activity globally, as well as by Workspace or Connector Id.
Messages
This chart is a snapshot of the number of messages received over your chosen time period. It shows you how many were successful, and how many caused an error. Hover over the bars in the chart to see counts of the two statuses.
Transactions by Workspace
This table gives you a breakdown of the number of messages in each workspace, and it compares them to the previous time period. This lets you observe trends in the volume of messages that each workspace is processing. You can Edit this widget to select which workspaces to display. By default it includes all workspaces.
Transactions by Connector Id
This table gives you a breakdown of the number of messages each connector has processed. It also compares them to the previous time period so you can observe trends in the volume of messages each connector is processing. You can Edit this widget to select which connectors to display. By default it includes all connectors.
EDI Documents
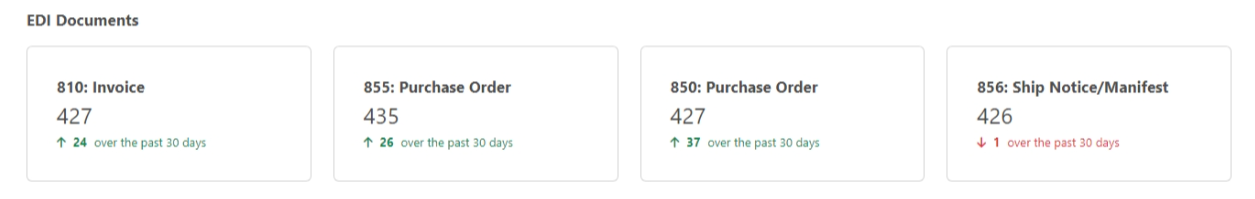
The EDI Documents section only appears if you have opted-in to the tracking of EDI transaction types. The Track Transaction Types checkbox is on the Advanced tab of some EDI connectors. When enabled, the application adds the transaction type as a tracked header on the message. The dashboard provides insight into the trends for between two and eight document types. You can Edit this widget to select which EDI Document types to display. Use the Hide checkbox to remove this section from the dashboard.
Recent Messages
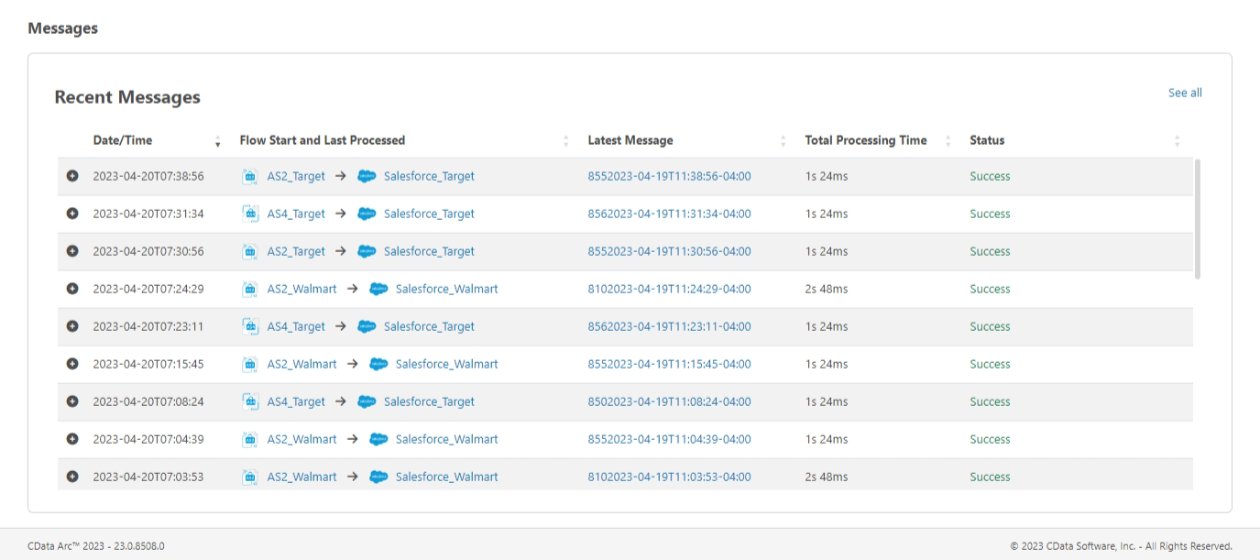
This is a simplified view of what you see on the Activity > Messages tab. It displays the 25 most recent messages. Click the See all link to go to the Messages tab and view the full list. See Messages Tab for details.