Partner Dashboard
Version 24.3.9159
Version 24.3.9159
Partner Dashboard
Each trading partner has its own dashboard, which is the EDI Partners landing page. By default, it displays metrics for the last 7 days, but you can use the Show data for dropdown to select your preferred time period. The options are:
- Today
- Past 24 hours
- Past 3 days
- Past 7 days
- Past 30 days
- Past 3 months
- Past 12 months
Note: The time periods shown vary based on your cleanup interval settings, so you might not see all of the time periods listed above.
The dashboard is divided into a number of sections, each of which is covered below. The dashboard is user-specific, so you can customize it to fit your needs by using the Edit button near the top of the page, or the Edit links on certain cards.
Key Metrics
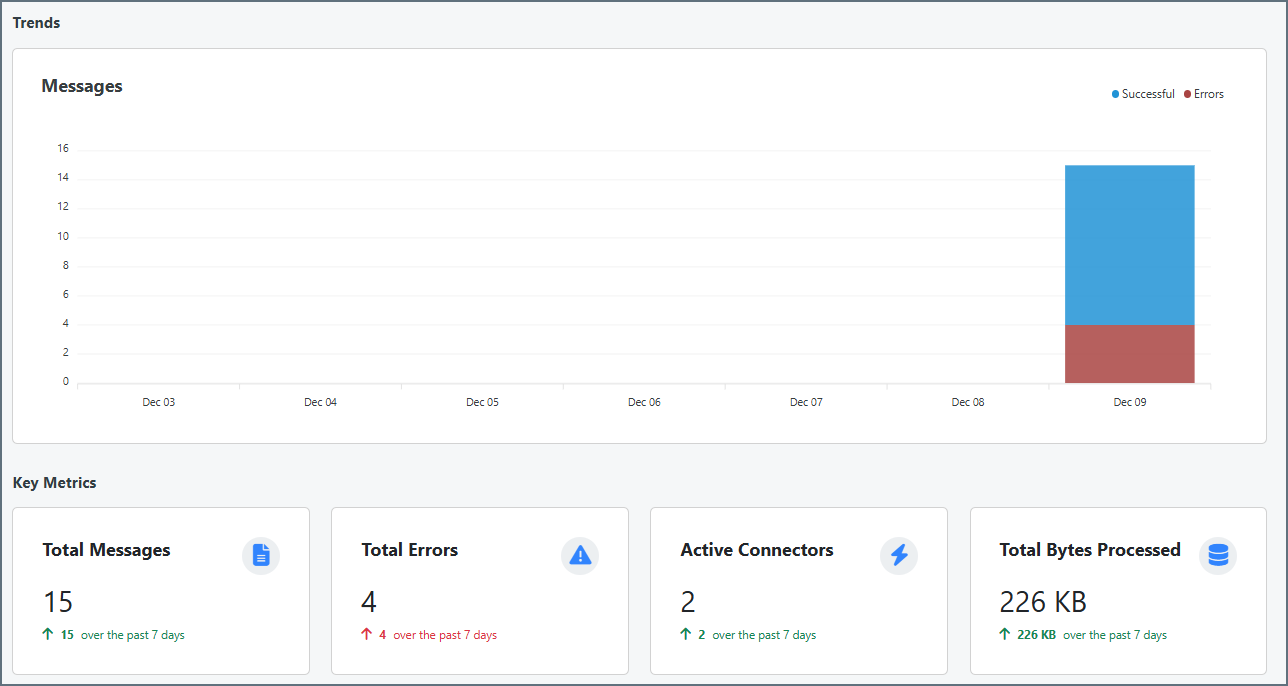
You can display between two and eight metrics that provide a view into your TPMC partner’s health, volume, and usage. To pick your metrics, click the Edit button, then click the Edit link in the Key Metrics section. Choose from the following list:
- Total Messages
- Total Transactions
- Total Transactions Sent
- Total Transactions Received
- Total MFT Transactions
- Total EDI Messages
- Total Errors
- Total Send Errors
- Total Receive Errors
- Total Connectors
- Active Connectors
- Total Workspaces
- Active Workspaces
- Total Bytes Processed
- Average Bytes Processed
- Average Processing Time
- Success Rate
- Failure Rate
- SLA Violations
- At Risk SLAs
Recent Messages
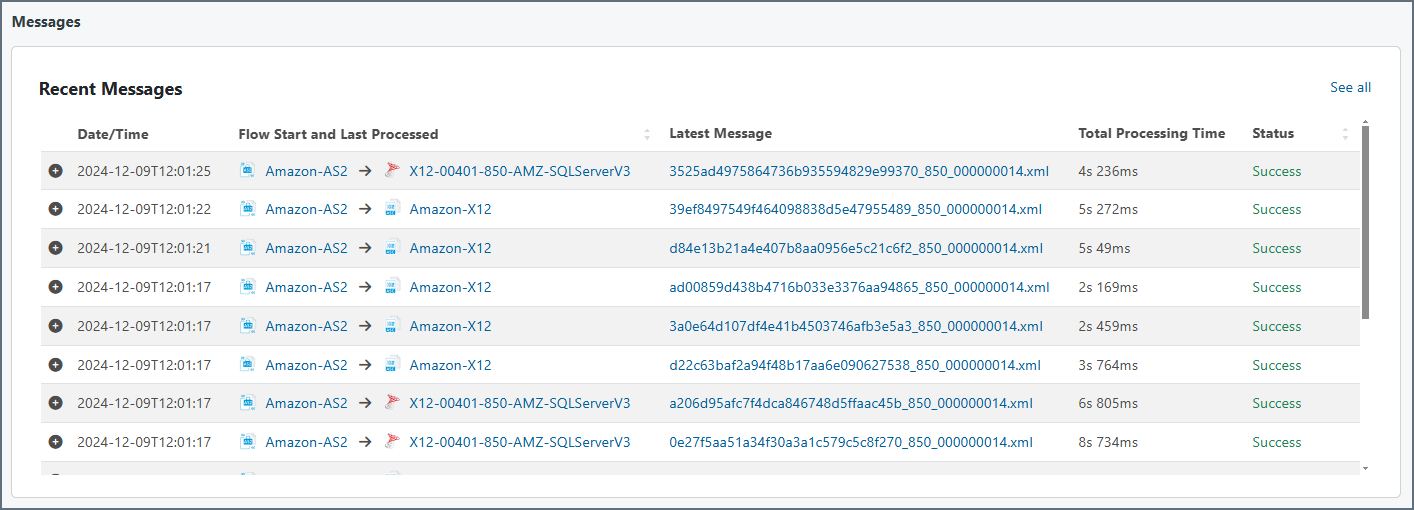
This is a simplified view of what you see on the Activity > Messages tab. It displays the 25 most recent messages. Click the See all link to go to the Messages tab and view the full list. See Messages Tab for details.