Activity Page
Version 26.2.9686
Version 26.2.9686
Activity Page
CData Arc maintains logs for multiple types of activities, including messages, transactions, SLAs, application and access requests, audit configuration changes, and profile activities. Use the Activity page to view and work with your logs. Each log type is stored as a separate table in the application database. View the application, access, audit, and profile logs from the Logs tab.
Note: Date/Time entries are always localized to the local time zone and date format settings of your browser, so even when you browse to a server hosted in a different time zone, the displayed timestamps reflect the local time.
Searching and Filtering the Logs
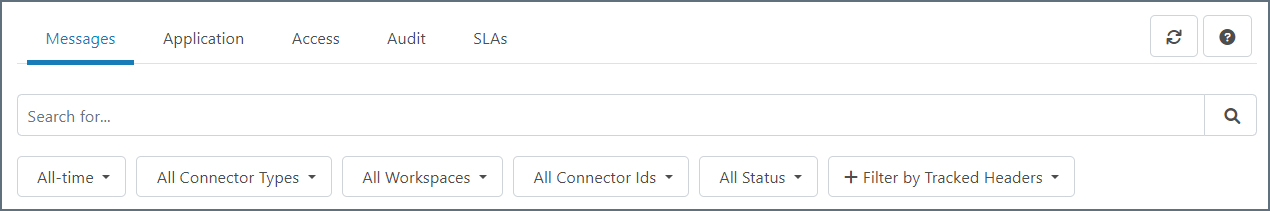
The top of each Activity page tab has a search bar that you can use to search all the logs on that page. Click the funnel icon to open a context-sensitive filter section with different options for each log type. For example, as shown in the following image, the Messages tab has filters for Tracked Headers, time, connector type, workspace, and status.
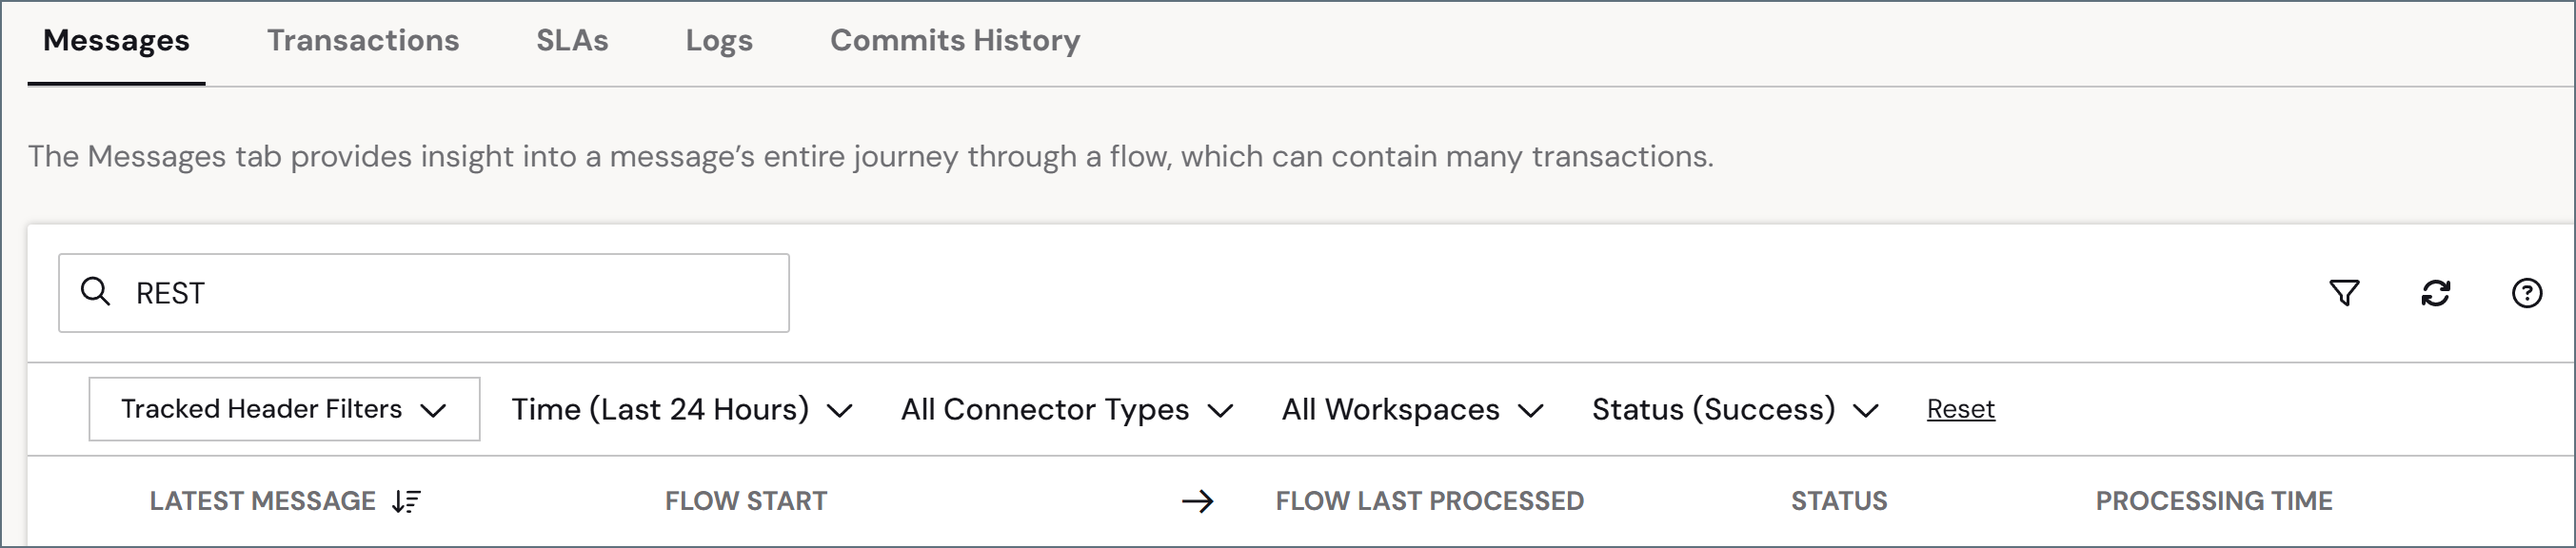
You can use filter options and the search bar in an individual search to narrow the results that are returned. The image below shows messages in the last 24 hours with a status of Success and the word ‘REST’ in the message text.
Tracked Headers
Arc supports using additional searchable metadata (Tracked Headers) as an additional way to filter results on the Messages tab. You can add tracked headers in a number of ways:
-
The Tracked Headers field in the Advanced Settings section of the Settings > Advanced page lets you provide a comma-delimited list of custom header names.
-
Some connectors, like X12, have settings in the Advanced tab that let you to opt-in to the tracking of certain headers, like ISA08.
-
The XML Map connector lets you right-click an element and add it as a tracked header on the output message.
-
The
_messageitem in ArcScript lets you set tracked headers through a_message.trackedheader:HeaderNamesyntax. To see other examples of using_message, read CData Arc Message.
Arc adds metadata headers to files as they are processed in the flow. Find the headers by hovering over a message and clicking View Details. You can do this by:
-
Expanding a message in the Messages tab
-
Opening the Message Details page
-
Viewing the Transactions tab for a connector
Messages Tab
The Messages tab provides insight into a message’s entire journey through a flow, which can contain many transactions. You might often want to see what happened with a message that you received, and this lets you see the full picture of the message as it traveled through the flow.
The Messages table contains the full list of messages. By default, the list is sorted by the Latest Message column, but you can click any column name to sort by it. It displays the following details:
- Latest Message—the latest filename for the message with a timestamp for the last activity related to this message. Click this link to open a window to preview the message content and optionally download, copy, or format it.
-
Flow Start and Last Processed—the Connector Id where the message originated, and the Connector Id of the last connector to process a transaction related to the message. Click a Connector Id to open the connector’s configuration page in the flow designer.
- Status—the status of the message. The options are:
- Success
- Warning
- Error
- Pending
- Skipped
- Total Processing Time—the amount of time that the message was in the flow for processing
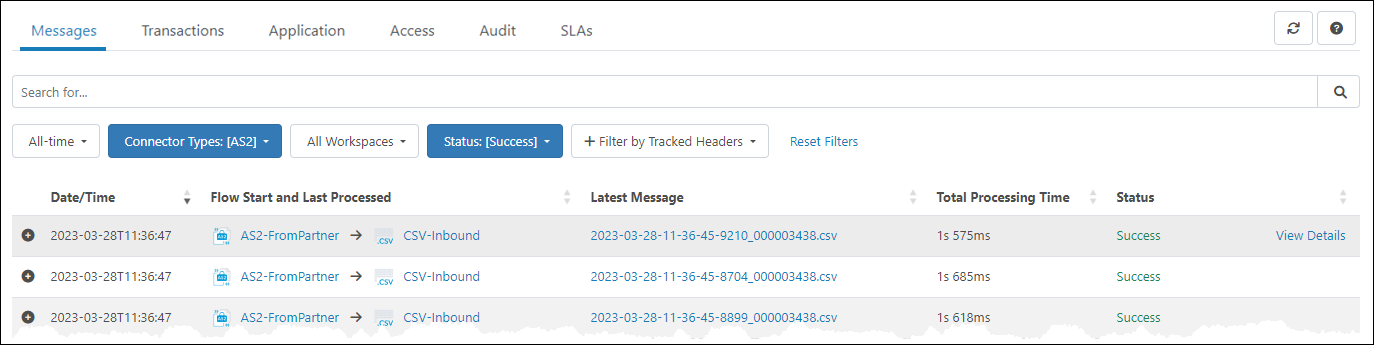
The search bar and filters section let you filter based on the columns mentioned above, as well as any Tracked Headers. The following image shows an example filter:
To open the Message Workflow page for a message, click the arrow that appears on the far right when you hover over the message. This page displays all steps in the flow, along with the associated documents, other details, and the logs.
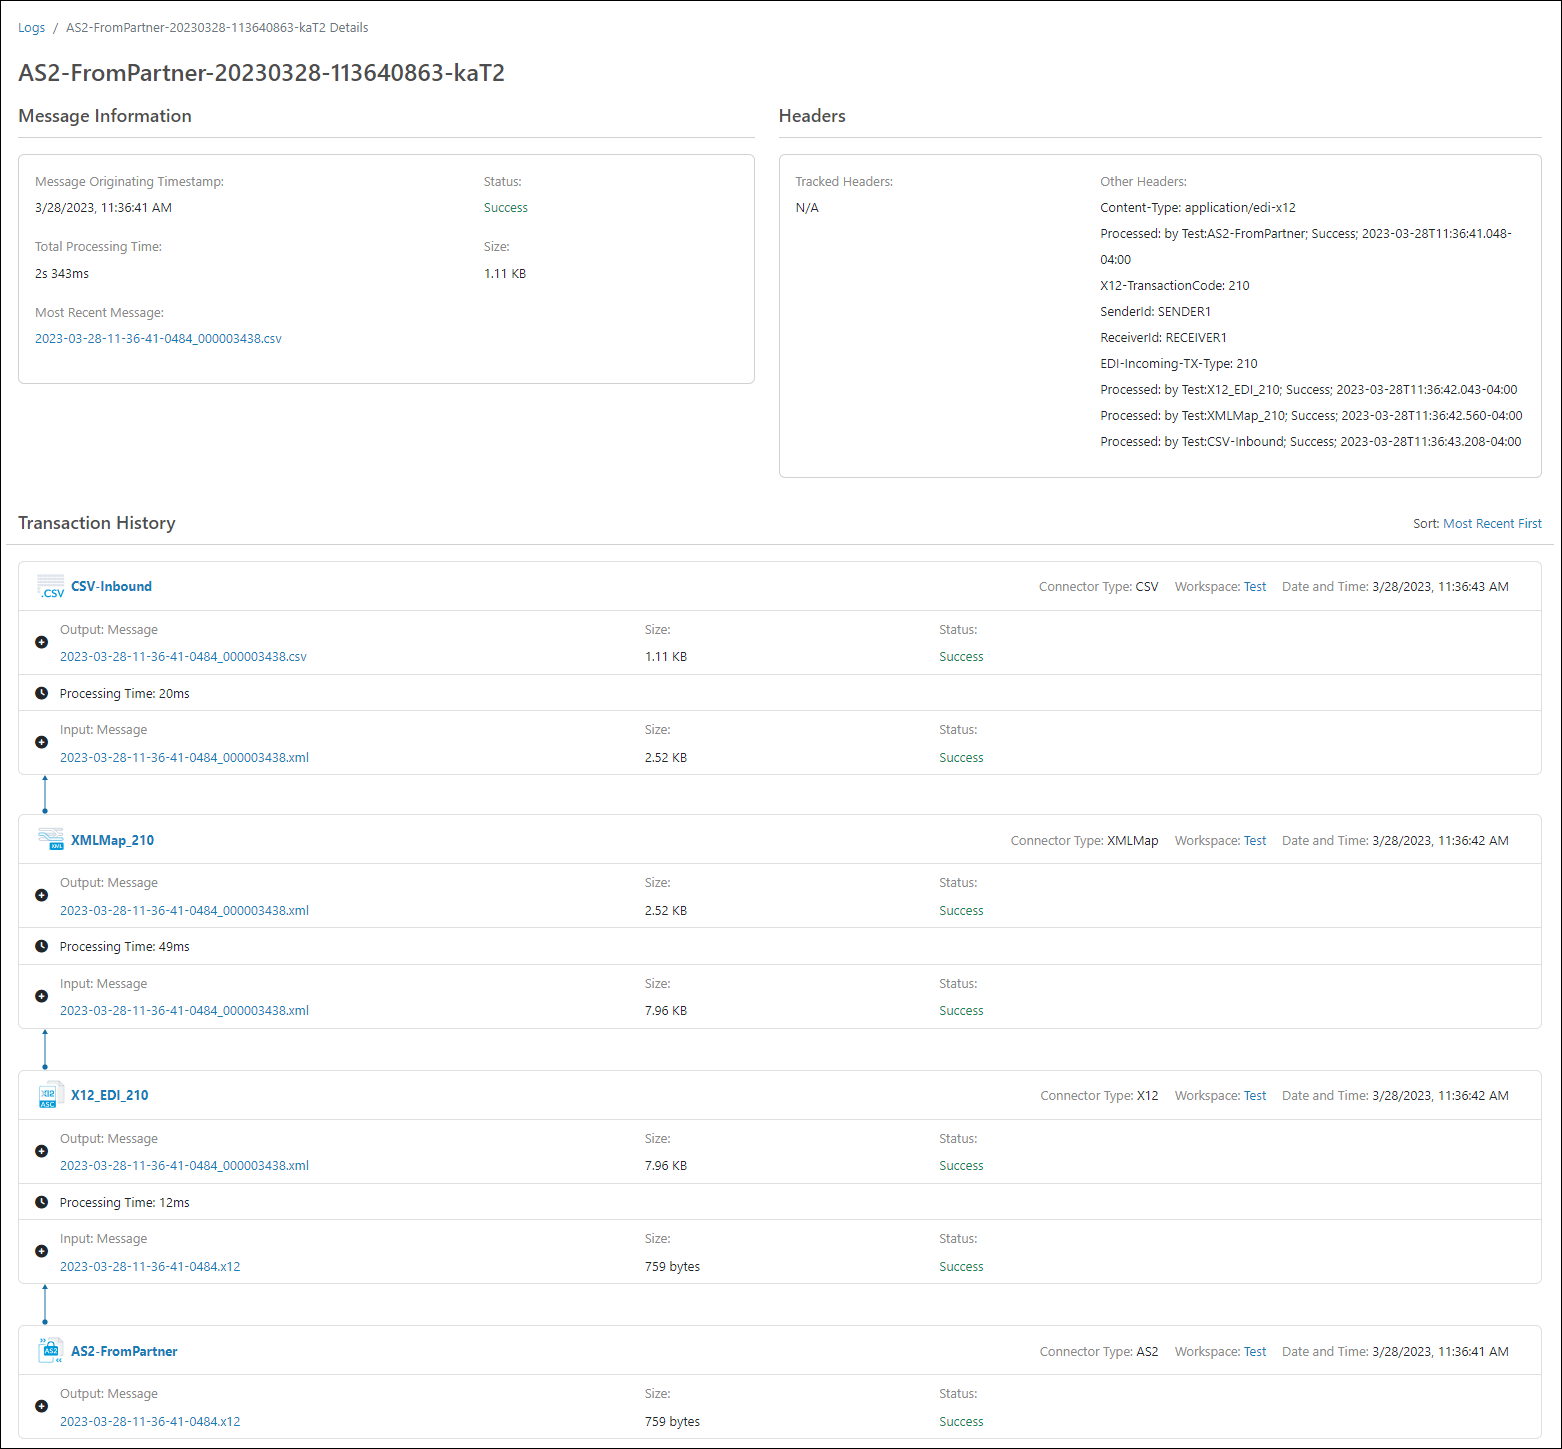
Use the expander to the left of a message to see the message Details, as shown below.
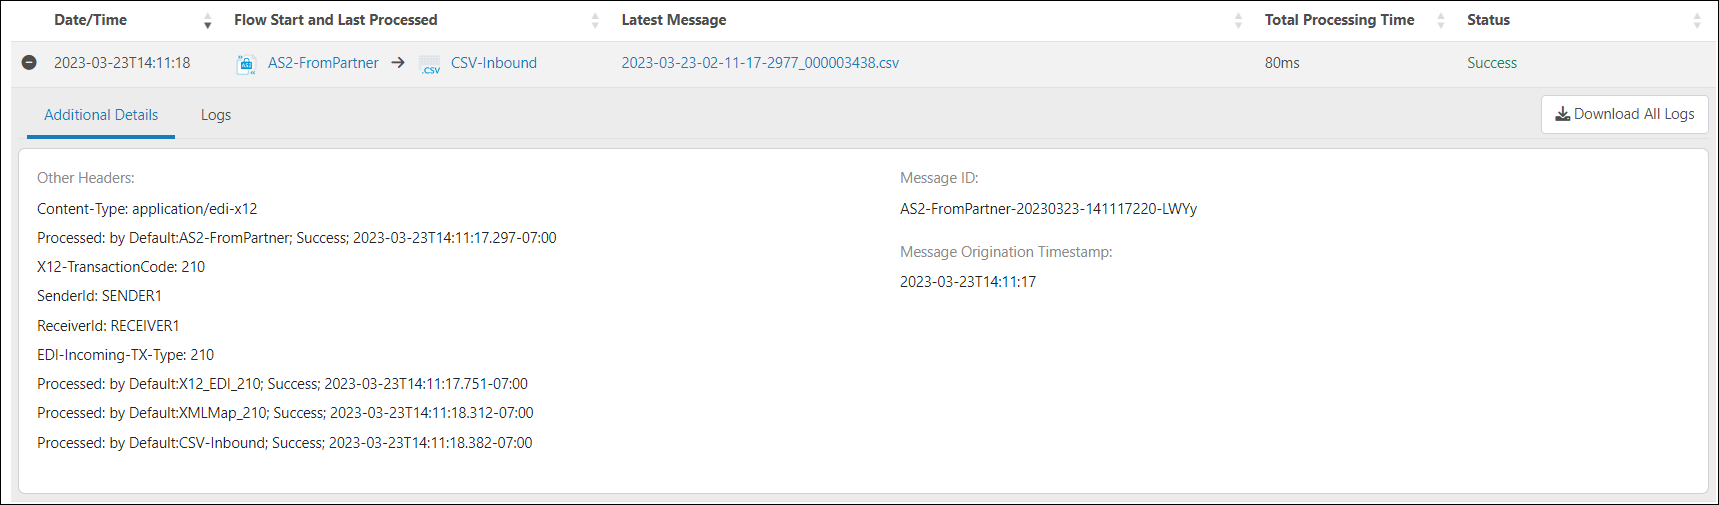
The card contains:
- The Message Id
- The time at which the message originated
- A list of Tracked Headers associated with the message
- A list of Other Headers associated with the message (not tracked)
- Messages that pertain to the message status. For example, if the status is Error, the card shows the error message that caused this status in the summary.
The Logs tab for the message lists logs that pertain to the processing of the message. To preview the log contents in the UI (and optionally download the file), click the link in the File Name column.
To view or download a log entry, click the Logs tab. Hover over the entry you are interested in, then use the download icon ![]() to download an individual log file. Alternatively, use the Download All Logs button to download a zip file containing all logs that pertain to the message.
to download an individual log file. Alternatively, use the Download All Logs button to download a zip file containing all logs that pertain to the message.
Transactions Tab
The Transactions tab contains detailed information regarding all incoming and outgoing file transfers and all files processed locally by data transformation connectors. For example, AS2 transaction logs contain HTTP request and response headers, the MDN response to the AS2 request, and any communication errors.
The Transactions table includes a separate row for each file processed by the application. It displays the following details:
- Date/Time—the timestamp for the transaction
- Processed by—the Id of the connector that processed the transaction
- Direction—whether the transaction was a Send or Receive
- File—a link to open the file that was processed
- Status—the status of the transaction. Successful transactions have a Status value of Success, while failed transactions report a status of Error.
- Size—the size of the transaction file
- Processing Time—the time it took to process the transaction
Use the expander to the left of a transaction to see additional details. These details include the same information described above. The only difference is that transaction logs only show information for a single transaction, while a message log might contain many transactions. You can also use the arrow that appears when you hover over a transaction to see the same workflow page.
Tip: You can also find Transaction information for a specific connector in the connector’s Transactions tab.
SLAs Tab
The SLAs tab stores information on every SLA configured on individual connectors. It includes information on which workspace the SLA is associated with, as well as status information and the time remaining in that status. It displays the following details:
- Connector Id—the Id of each connector with a defined SLA
- Workspace—the name of the associated workspace
- Previous Status—the prior SLA status (for example, OK)
- Current Status—the current SLA status (for example, At Risk) and the time remaining before the SLA changes status again (for example, to In Violation)
Logs Tab
The Logs tab contains four sets of logs: Application, Access, Audit, and Profile. By default, each table includes a summary count of today’s logs, and a total count of all logs. Click the See All link in each section to populate the window with the full list of logs in that category. From here you can search, filter, and download logs in the same way as the other log types.
Application Logs
The application logs record any application-level errors that occur during processing and any requests made to application resources. The error messages here can help provide context to errors for specific transactions.
Use this tab to verify that external trading partners’ web requests are successfully routed to a connector within the Arc flow. When the application receives a web request at a public endpoint, it attempts to route the message to a specific connector based on message headers (for example, AS2 Identifiers). If an error prevents the application from routing the message successfully, this error appears on the Application tab.
The Application table includes a separate row for each application event. It displays the following details:
- Date/Time—the timestamp for the event
- Level—the log level. Review the information in the Message column for details. The options are:
- None—events are not logged
- Error—information about errors encountered during processing
- Warning—information about warnings encountered during processing
- Info—general information about the processing, including any errors and warnings (if applicable)
- Debug—detailed debugging information for both successful and failed processes
- Trace—detailed trace information for both successful and failed processes (useful if you need to send logs to CData Support)
You can change the log level in the Advanced Settings section of the Settings > Advanced page. However, increasing the verbosity of the logs can affect database performance, especially for less performant database types like SQLite or H2. Only adjust the log level if you have a specific reason to do so. Note: Logging levels Debug and Trace might log sensitive information, including file information and SSL certificates. Although sensitive details such as passwords are masked, you should review these logs for sensitive information before sharing them outside of your organization.
- Resource—the resource that produced the message
- Message—the message text
- Instance Id—the machine on which the event occurred
Access Logs
The access logs record entries for requests that are made to endpoints that it provides. This includes API requests, connectors that expose a public endpoint (for example, Webhook), and public endpoints related to receiving data (for example, public.rst). It displays the following details:
- Date/Time—the timestamp for the transaction
- Method—the HTTP method used
- URL—the URL
- User—the authenticated user who made the request. If the user who made the request was anonymous, this entry is blank.
- Remote IP—the IP Address where the request originated
- Instance Id—the Id of the instance that served the request
Audit Logs
The audit logs store each change made to the application configuration. This includes all actions, such as creating connectors, configuring connectors, updating profile settings, and so on. It displays the following details:
- Date/Time—the timestamp for the configuration change
- Action—the type of change that was made. The options are:
- GET
- POST
- PUT
- MERGE
- PATCH
- Resource—either the Admin Console (the web UI that serves as the typical interface for managing and configuring the application) or the Admin API (the REST-based API that can be consumed to manage and configure the application).
- Message—text describing the change
- User—the user who made the change
You can query the Audit logs to perform audits of the application configuration.
Profile Logs
The profile logs record activity from configured communication profiles. This includes file transfers, protocol-level events, and server activity for profiles such as AS2, AS4, and SFTP Server. It displays the following details:
- Date/Time—the timestamp of the activity
- Connector—the Id of the connector involved
- File—a link to open the log file for the profile
- Status—the status of the action. Options are Complete, In Progress
Tamper-Evident Logging
Arc includes cryptographic tamper-evident logging on all Audit logs. This ensures that the user is alerted anytime that log data is altered or tampered with. It works by creating an immutable audit trail of system activities by cryptographically linking log entries in a chain, making unauthorized modifications immediately detectable. Each log entry includes a cryptographic hash of both its own content and the previous entry’s hash, creating a verifiable chain where any alteration to historical records breaks the chain’s integrity. This approach helps organizations comply with regulatory requirements such as HIPAA and GDPR.
Integrity checks run hourly, as part of the application health checks. If tampering is detected, an error is logged. If email alerts are configured on the Alerts tab, an email is sent to administrators.
Administrators can use the integrityResetTampering operation to reset the hash chain and clear tampering warnings.
Debug Logging
Some connectors have settings in the Advanced configuration tab to enhance the verbosity of transaction logs. These detailed logs are useful when debugging, and are often necessary when requesting support from [email protected].
The most common Advanced configuration setting is Log Level. When set to Debug, additional information is added to the transaction logs that are already generated when processing a transaction.
Some connectors that send outgoing requests also have a Log Requests setting. When set to True, transaction logs include a copy of the request as it was sent to the remote server. This can be useful in narrowing the scope of any issues receiving server responses.
Some connectors that issue queries against remote systems have Verbosity and/or Logfile settings. The Verbosity should be set between 1 and 5 (where 5 is the most verbose, and recommended in most cases). When Logfile is an available setting, set it to a path on disk to write the dedicated logfile; you can provide this file to Support with the transaction logs generated when processing a transaction.