Logs
Version 25.3.9411
Version 25.3.9411
Logs
The Logs page of API Server maintains query and application logs. Each log has its own tab on the Logs page:
-
Query - The Query tab contains details about the queries that are made to your API Server account.
-
Application - The Application tab records application errors and requests made to application resources.
Query Tab
The Query tab displays a list of performed queries and the following information for each one:
-
TIMESTAMP - The date and time that you ran the query, formatted as YYYY-MM-DD HH:MM:SS UTC.
-
QUERY TYPE - The type of query, such as batch, procedure, index, table, or column.
-
USER - The login Id of the API Server user who makes the query.
-
STATUS - The final state of the query: Success or Failed.
-
QUERY TEXT - The text and destination of the query.
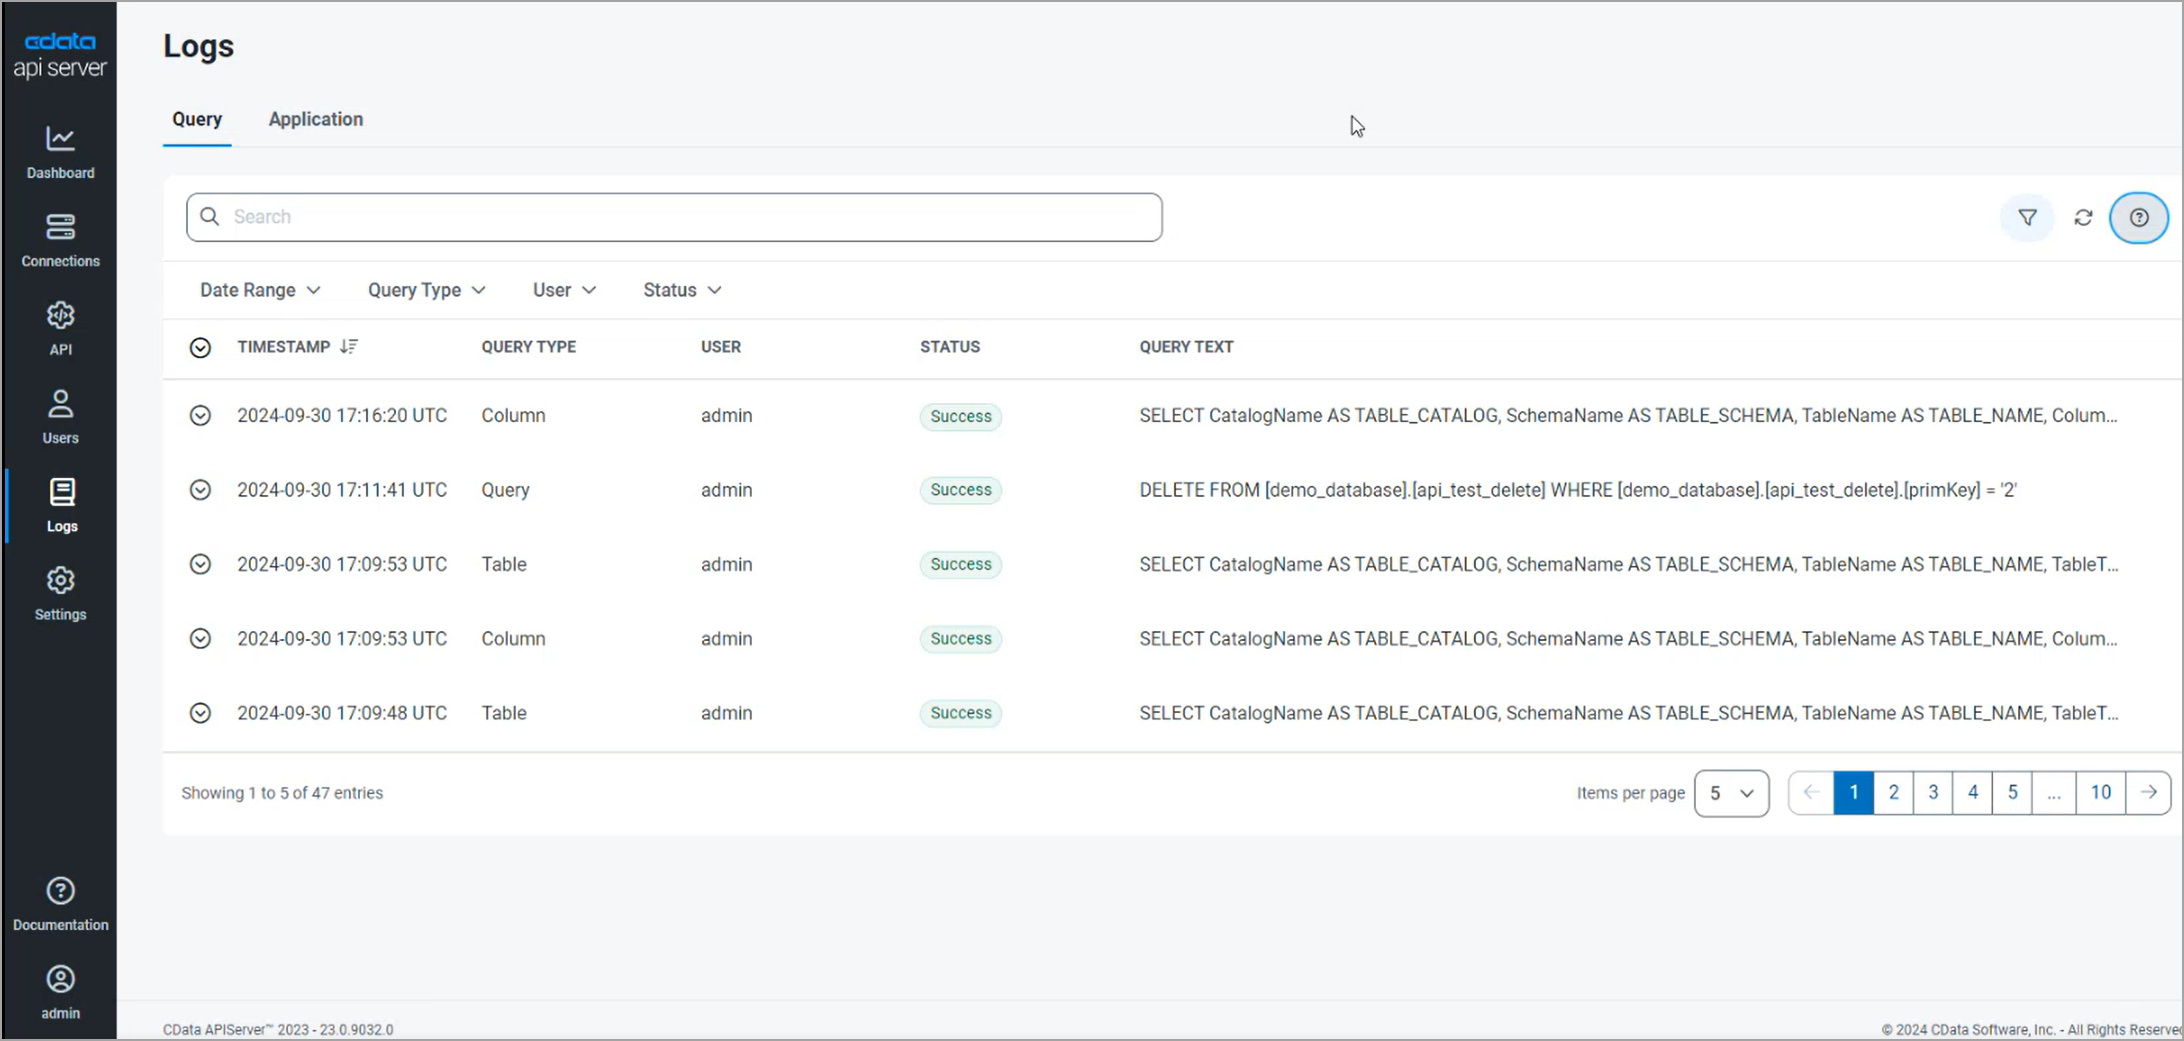
At the bottom of the query table, you can select the number of queries to display per page, and you can navigate between pages of results.
Query Details
Click the Expand icon to the left of the timestamp to view the entire message of a single log entry. The fields and contents can vary between queries of different types.
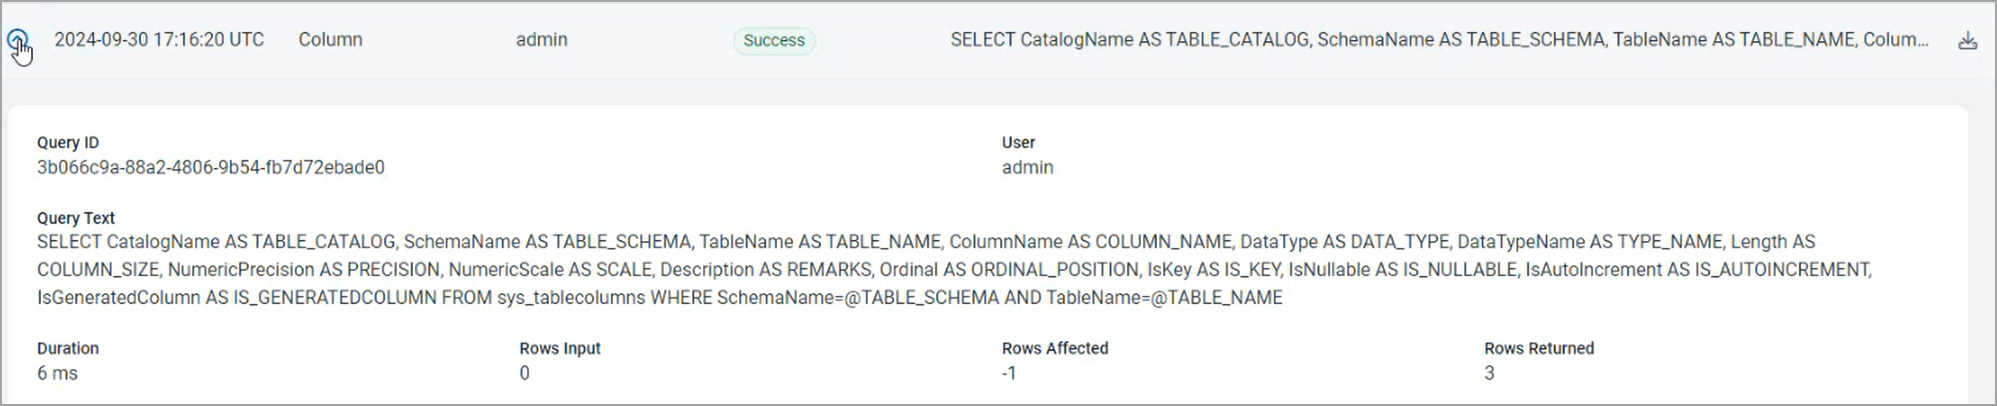
You can also click the Expand icon to the left of the TIMESTAMP column header to expand every log entry.
Click the Download icon (![]() ) in the query details to download the log file for that query.
) in the query details to download the log file for that query.
Note: You can increase or decrease the logging verbosity for a connection on the Edit Connection page of a connection. See Connections for more information.
Searching, Filtering, and Sorting
Use the search bar to search for specific query text.
You can filter the query table by date range, query type, user, and status by clicking the Filter icon (![]() ) and choosing the filters you want. For example, to choose a custom date range, click the Filter icon, and the click the arrow to the right of Date Range.
) and choosing the filters you want. For example, to choose a custom date range, click the Filter icon, and the click the arrow to the right of Date Range.
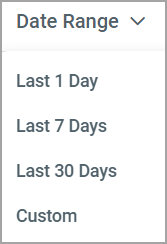
Select one of the options or enter a custom date range in the Custom Date Range dialog.
Click the Filter icon again to hide the filter. To clear all filters, click the Refresh icon (![]() ).
).
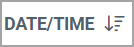
You can also change the sort order of the query table by clicking the Arrow icon next to the TIMESTAMP column header:
![]()
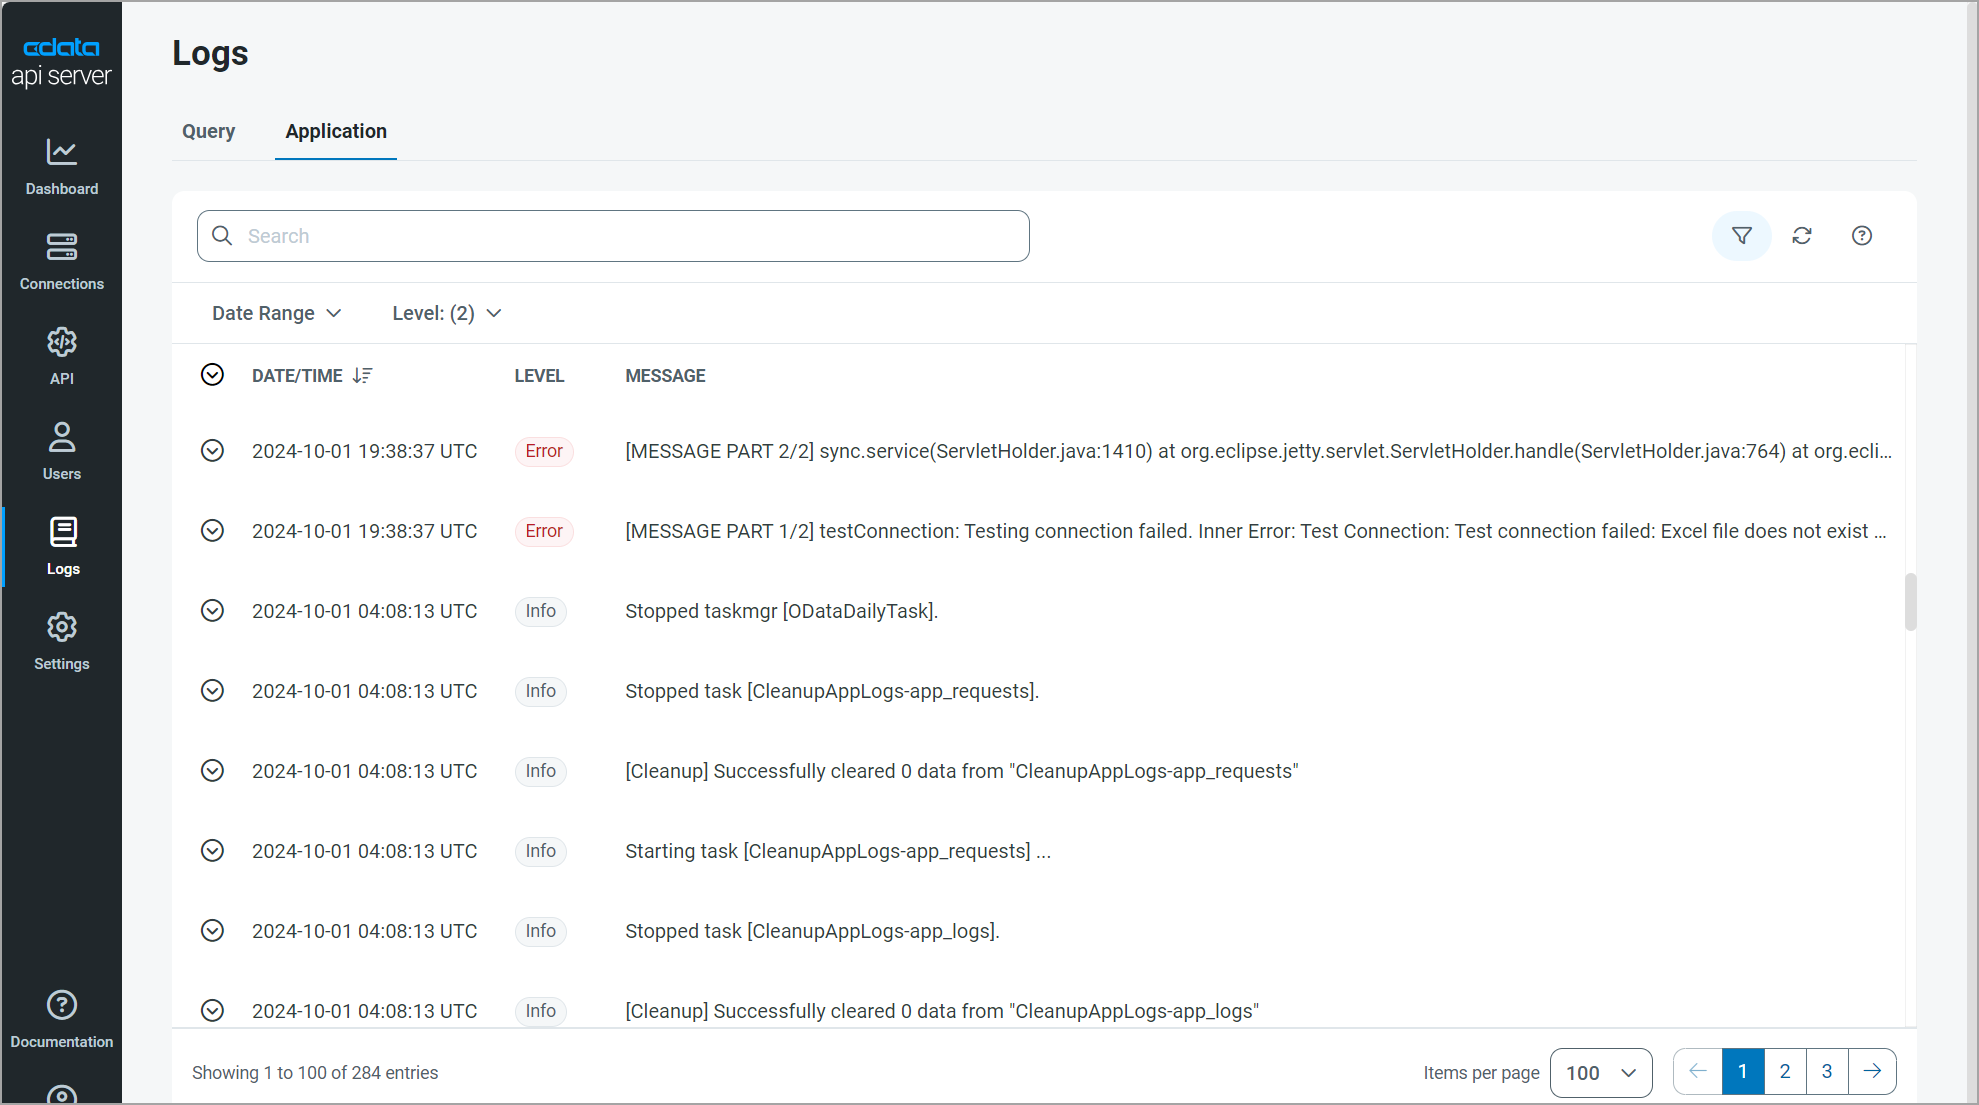
Application Tab
The Application tab records any application-level errors that occur during processing and any requests made to application resources, such as starting and stopping tasks. These messages can help provide context to errors for specific transactions.
The Application tab includes a separate row for each application event, displaying the following details:
-
DATE/TIME - The date and time of the application event, formatted as YYYY-MM-DD HH:MM:SS UTC.
-
LEVEL - The log level. The application levels that are displayed in the column are as follows:
-
Error - Information about errors that are encountered during processing.
-
Warning - Information about warnings that are encountered during processing.
-
Info - General information about the processing, including any errors and warnings (if applicable).
-
Debug - Detailed debugging information for both successful and failed processes.
-
Trace - Detailed trace information for both successful and failed processes. This information is useful if you need to send logs to CData Support.
-
-
MESSAGE - A message text about the event.
At the bottom of the query table, you can select the number of queries to display per page, and you can navigate between pages of results.
Application Details
Click the Expand icon to the left of the timestamp to view the entire message of a single log entry:
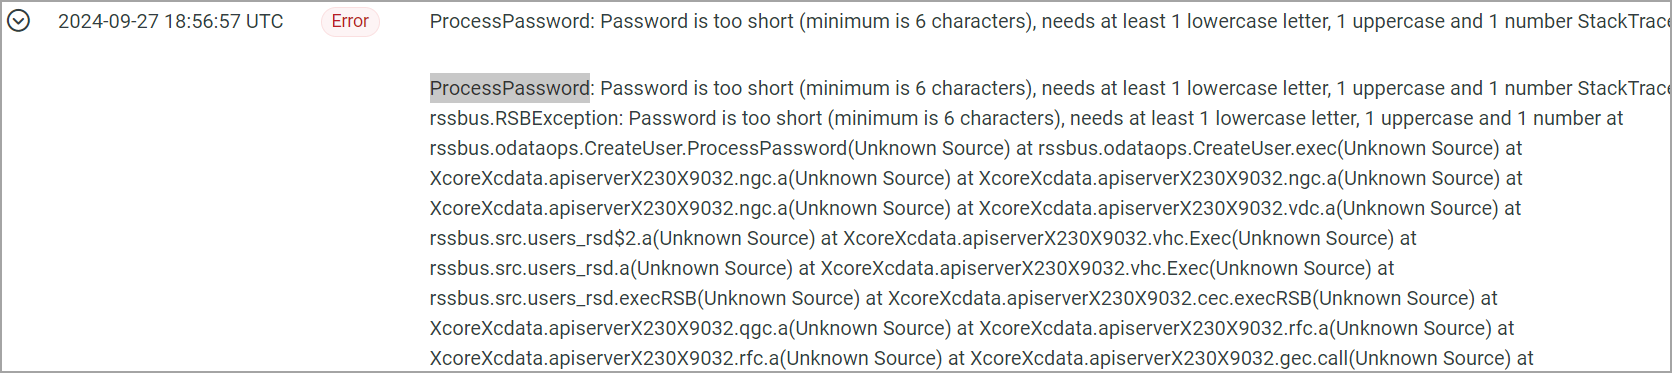
You can also click the Expand icon to the left of the DATE/TIME column header to expand every log entry.
Searching, Filtering, and Sorting
Use the search bar to search for specific message text.
You can filter the application log table by date range and level by clicking the Filter icon (![]() ) and choosing the filters you want. For example, to choose a custom date range, click the Filter icon, and the click the arrow to the right of Date Range.
) and choosing the filters you want. For example, to choose a custom date range, click the Filter icon, and the click the arrow to the right of Date Range.
Select one of the options or enter a custom date range in the Custom Date Range dialog.
Click the Filter icon again to hide the filter. To clear all filters, click the Refresh icon (![]() ).
).
You can also change the sort order of the query table by clicking the Arrow icon next to the DATE/TIME column header: