Dashboard
Version 25.3.9411
Version 25.3.9411
Dashboard
The CData API Server dashboard presents your recent queries and account activity in a streamlined and easy-to-understand visual format.
The Dashboard page is the main landing page that is displayed when you open the API Server Admin Console. The Admin Console provides the navigation controls that enable you to access various application pages. Within the console, the Dashboard page provides metrics and KPIs that you need to help you manage your queries and connections.

By default, the dashboard displays metrics for the last 24 hours. You can use the button in the upper right corner to display a list from which you can select your preferred time period. You can choose from these options:
-
Last 24 hours (the default increment)
-
Last 7 days
-
Last 30 days
-
Last 12 months
Selecting a time period from this list refreshes the page and adjusts the displayed data accordingly.
The dashboard displays your activity in two categories:
-
information boxes
-
data visuals
Information Boxes
The top section of the dashboard displays four information boxes that contain quantities for each of the following categories in the selected time period:
-
Rows - Lists the total number of rows that are processed in the specified time period.
-
Queries - Lists the number of queries that are performed in the specified time period.
-
Active Connections - Lists the number of active connections in your account.
-
Active Users - Lists the total number of active users in your account.
Underneath the count, each box displays the percentage change compared to the previous time period. This percentage change adjusts dynamically based on the time period that is selected. For example, if you choose the time period Last 24 hours, API Server compares the past 24 hours to the previous 24 hours. In these boxes, the green messages indicate an increase for the metric in that box compared to the previous time period; red messages indicate a decrease compared to that time period.
Data Visuals
Below the information boxes, the Dashboard page displays three visuals:
-
Queries Over Time
-
Queries by Connection
-
Queries by User
Queries Over Time
This bar graph shows the total number of queries that are made through your API Server account over the selected time period. The X-axis displays the dates, and the y-axis displays the number of queries.
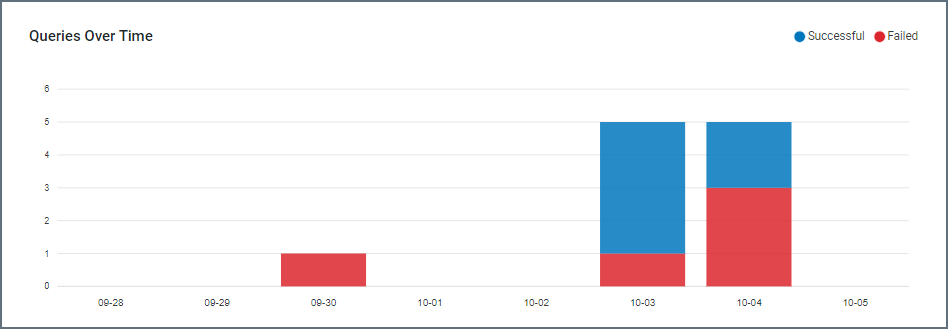
Each bar is composed of two sections:
-
the number of successful queries, displayed in blue as the top portion of the bar
-
the number of failed queries, displayed in red as the bottom portion of the bar and colored red
Queries by Connection
This table displays the number of queries that are made by each connection in the selected time period.
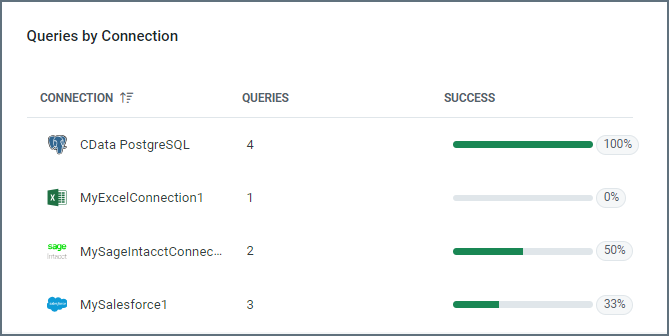
This table contains three columns:
-
CONNECTION: The name that you specified for the connection on the Connections tab.
-
QUERIES: The total number of queries, both successful and failed, that are made by the connection in the selected time period.
-
SUCCESS: The percentage of queries from the connector that succeed in the selected time period.
By clicking the arrow next to the Connection column, you can sort the connections in ascending or descending order. If the table is already sorted by the selected column, the sort function toggles between ascending and descending order.
Queries by User
This table presents a detailed analysis of the queries that are submitted by each user within the chosen time period.
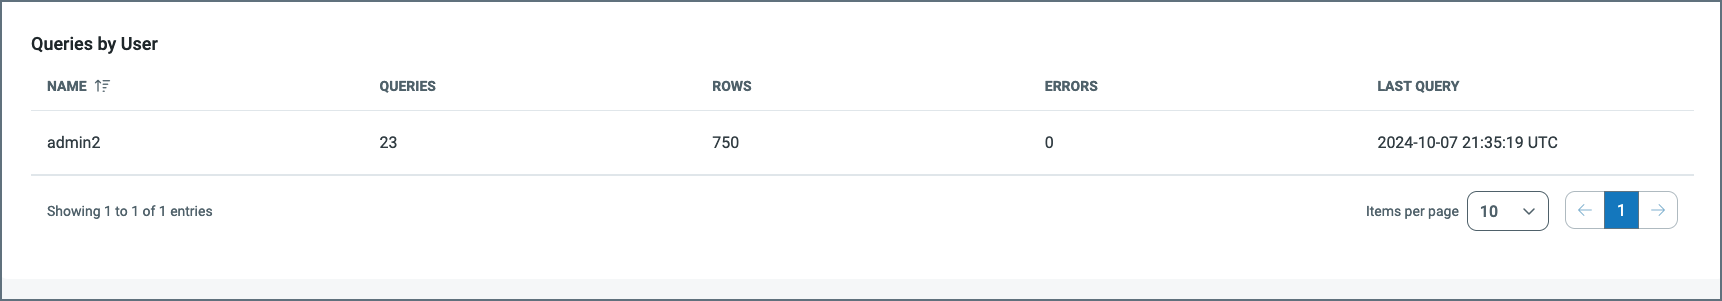
The details are presented in five columns:
-
NAME - The name of the user who performs the queries.
-
QUERIES - The number of queries that are performed by the user in the selected time period.
-
ROWS - The number of rows that are processed by the user in the selected time period.
-
ERRORS - The number of failed queries for the user in the selected time period
-
LAST QUERY - The date and time of the user’s last query, in the YYYY-MM-DD HH:MM:SS UTC format.
By clicking the arrow next to the NAME column, you can sort the rows in ascending or descending order. If the table is already sorted by the selected column, the sort function toggles between ascending and descending order.
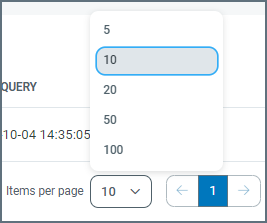
In addition, you can specify the number of rows that you want to display in the table by selecting a number from the Items per page list at the bottom of the page.